Results 1 to 5 of 5

Thread: Emmerdale TV viewing ratings

  1. #1
    Join Date
    Sep 2013
    Posts
    1,085
    Thanked: 706

    Emmerdale TV viewing ratings

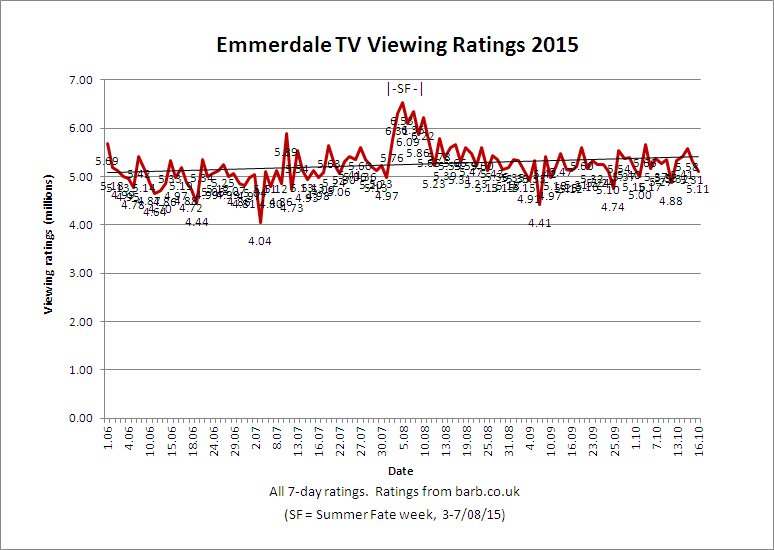
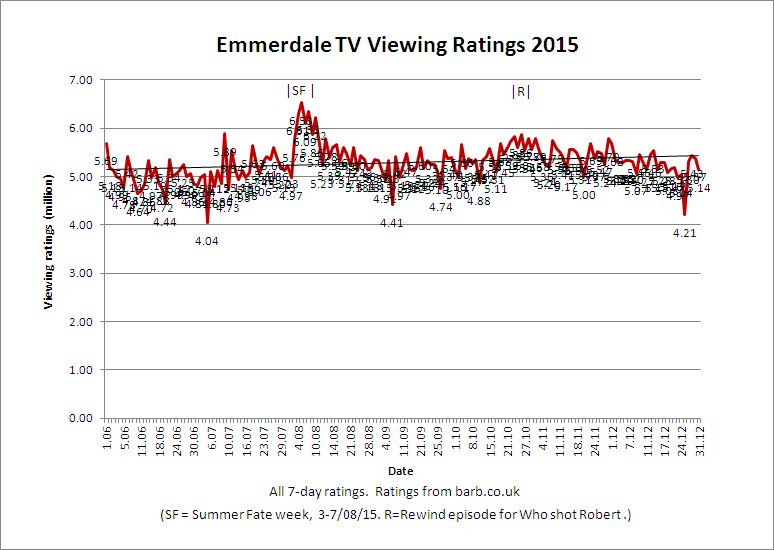
    Here's a picture showing the available viewing ratings for Emmerdale from June 1st to August 28th.


    The average trend is upwards, as seen in the straight line across the graph, so Emmerdale is gradually getting more regular viewers.

    Summer Fate caused a temporary big peak for Monday August 3rd - Friday 7th 2015, but after Monday 10th (6.22m), ratings dropped down towards 5.59m by Friday 14th. Tuesday August 25th was 5.66m overnight for when James and Pete looked for Ross in the woods and Ross was seen in hospital at the end of the episode. Compared to Friday 24th July (5.36m), Emmerdale seems to have gained about 0.3m new regular viewers by August 25th.

    Emmerdale viewer ratings were 5.76-6.53m for Summer Fate week 3-7/8/15.

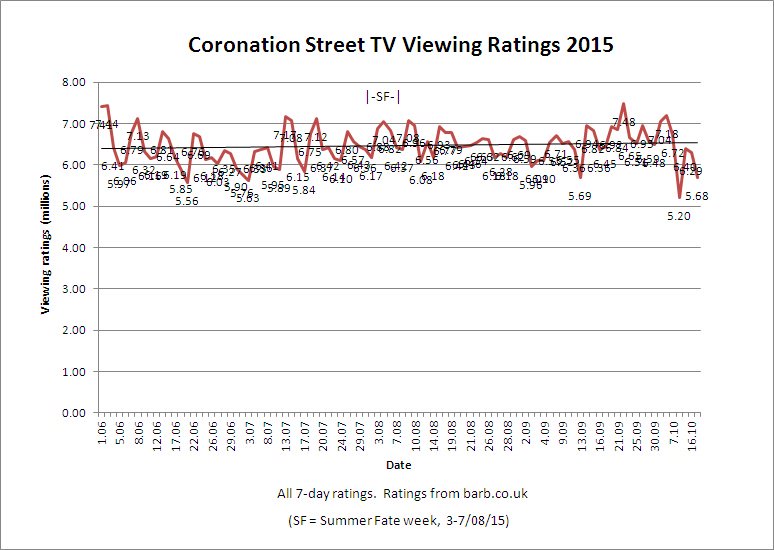
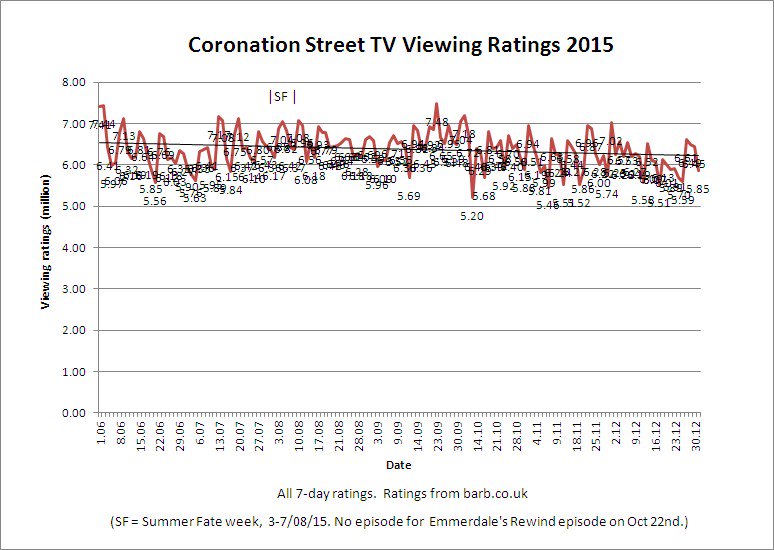
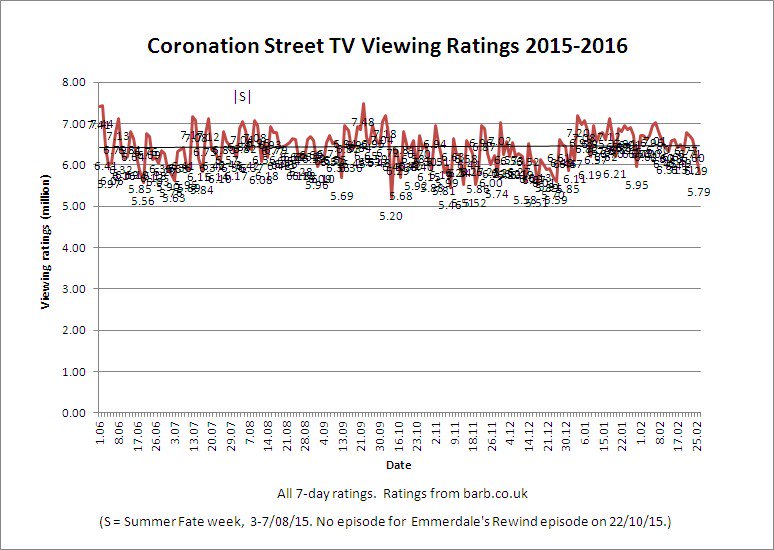
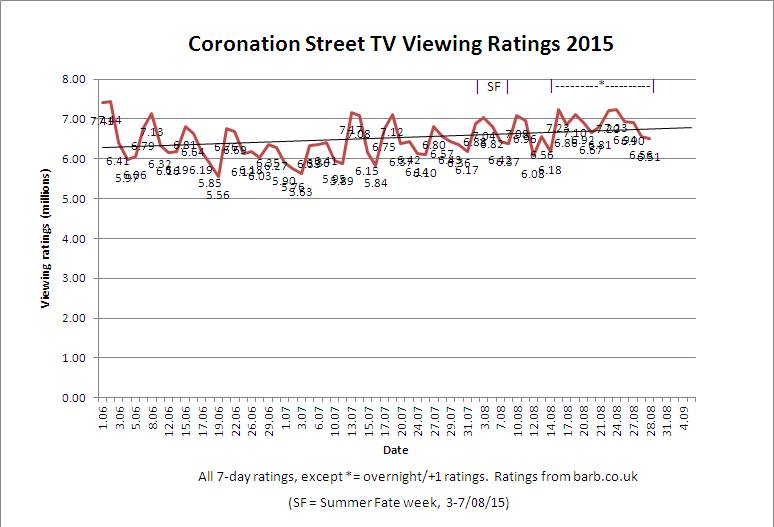
    Coronation Street viewer ratings were 6.37-7.04m for Summer Fate week.

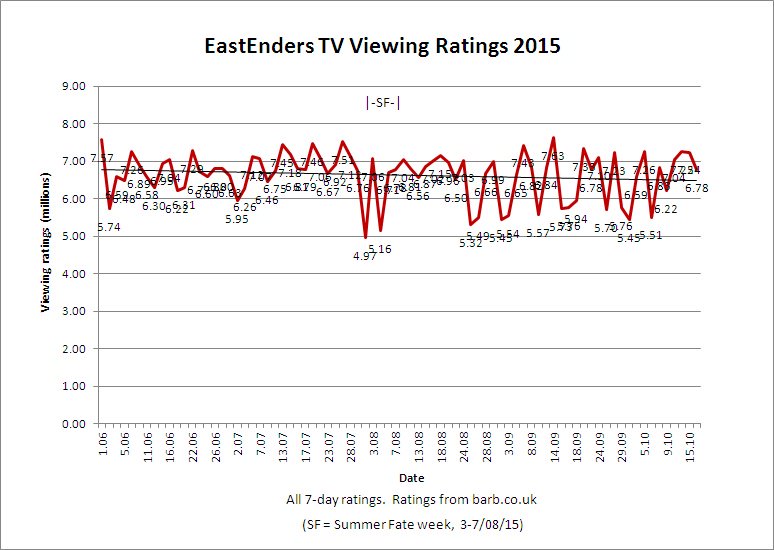
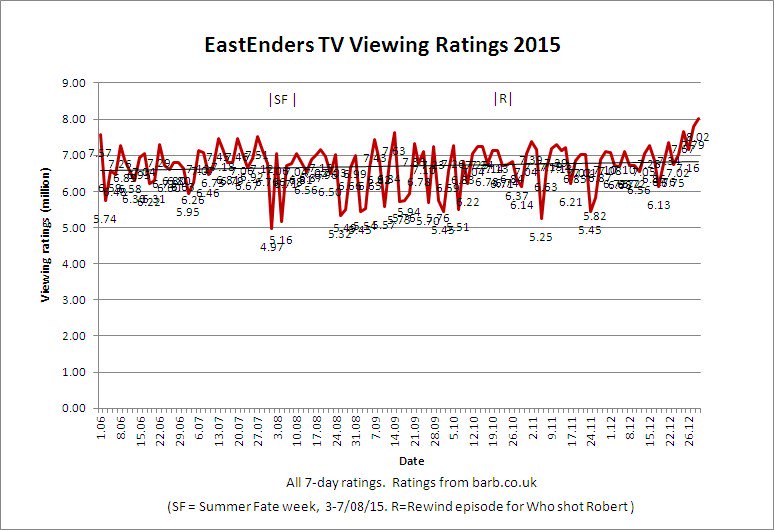
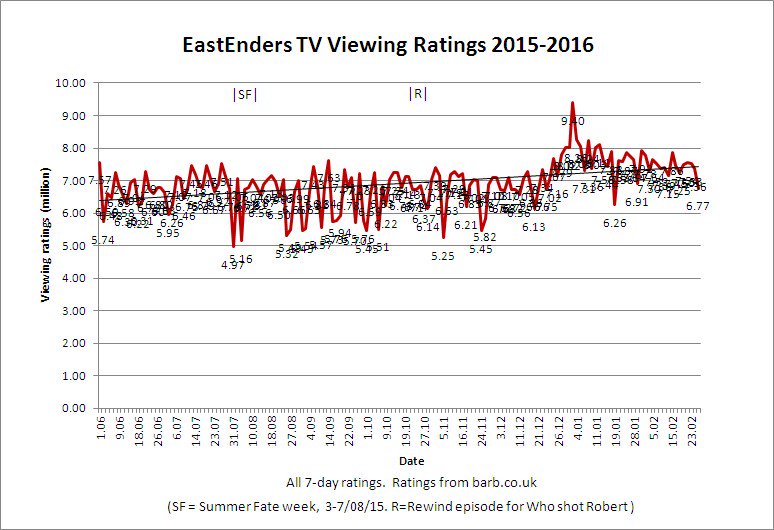
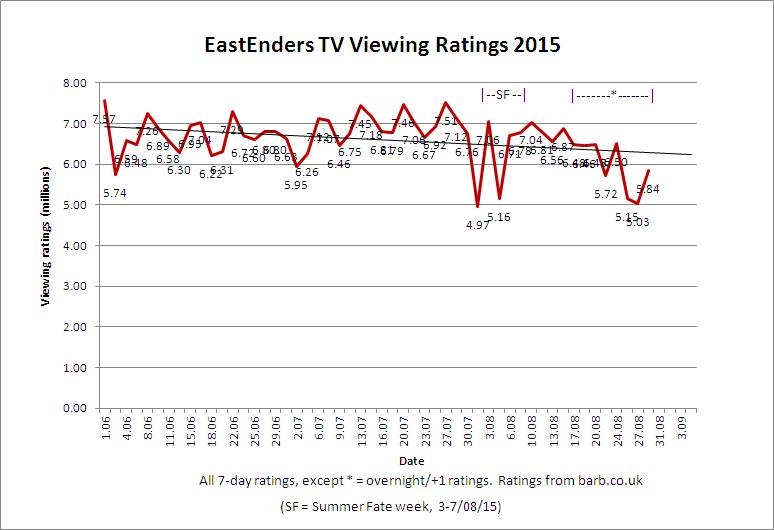
    EastEnders viewer ratings were 5.16-7.06m for Summer Fate week.

    Hollyoaks viewer ratings were 0.86-1.08m (1.08m for Wednesday 5/8/15 at 6.30pm) for Summer Fate week.

    The Great British Bake Off (BBC1) on Wednesday 5/8/15 at 8pm had 11.62m.

    For comparison, here are pictures for EastEnders and Coronation Street for recent viewing ratings.


    Last edited by Telly Watcher; 30-08-2015 at 14:45.

  2. #2
    Join Date
    Sep 2013
    Posts
    1,085
    Thanked: 706
    Here are the latest viewing ratings from barb.co.uk for the three main UK soaps.

    7-day viewer ratings are shown from 01/06/15 to 16/10/15 (twenty weeks) for viewers per episode for results collected over 7 days from first airing of episode. These include viewer playback and a much larger audience sample so are more accurate than the overnight ratings which only sample about 5,100 homes (about 11,500 people, aged 4yo+) but which can be under-estimated or over-estimated by as much as 0.5-1.0+ million.

    The 7-day viewer ratings for the Rewind 'Who shot Robert' episode on Thursday 22nd October are not yet available.

    Emmerdale shows an trendline which increases from 5.05 million to 5.45 million (+7.9%) over the twenty-week period, an average gain of 0.40 million viewers per episode by 16th October 2015 compared to 1st June 2015. After the effects of Summer Fate week settled from 11th August, variations about the trendline have been fairly stable. Emmerdale is the most improved for growth (+8%) in viewer ratings of the three main UK soaps for the twenty-week period.


    Coronation Street shows a trendline which increases from 6.40 million to 6.55 million (+2.3%) over the twenty-week period, an average gain of 0.15 million viewers per episode by 16th October 2015 compared to 1st June 2015. Recent low ratings are due to the effects of early episode start-time/reduced Friday night audience.


    EastEnders shows a trendline which decreases from 6.75 million to 6.50 million (-3.7%) over the twenty-week period, an average loss of 0.25 million viewers per episode by 16th October 2015 compared to 1st June 2015. Large fluctuations about the trendline occur from end of July 2015. Some of the low viewer ratings occurred when EastEnders clashed with Emmerdale, with Emmerdale having the more stable audience. From 15th September 2015 to 6th October 2015, there were seven clashes resulting in falls in EastEnders viewer ratings of between 1.34 million to 1.90 million, with an average fall of 1.66 million (-22.5%), nearly one-quarter of the EastEnders audience. EastEnders is the only one of the three main UK soaps to have lost viewer ratings for the twenty-week period.


    Brief description and videos which explain how viewing ratings are measured by BARB can be seen at:
    http://www.barb.co.uk/resources/barb...-do-what-we-do

    Frequently asked questions answered by BARB at:
    http://www.barb.co.uk/resources/barb-facts/faq
    Last edited by Telly Watcher; 30-10-2015 at 13:46.

  3. #3
    Join Date
    Sep 2013
    Posts
    1,085
    Thanked: 706
    Here's an interim snapshot of the latest 7-day BARB viewer ratings for Emmerdale which includes the 'Who shot Robert' Rewind episode on October 22nd. Surprisingly, there isn't much of a difference from the trendline for the growing usual TV audience though. I suspect that the next "big peak" for viewer ratings might be for the Andy/Robert car crash due to be aired on TV on Thursday, November 12th?


  4. #4
    Join Date
    Sep 2013
    Posts
    1,085
    Thanked: 706
    Here are the graphs for the official BARB 7-day viewer ratings for the three main UK soaps for 1st June 2015 to 31st December 2015.


    Emmerdale shows a progressive increase in viewer ratings over the 7 month period. Just why the Christmas 25th December episode shows such a low is very difficult for me to explain. Maybe very poor prior reviews for the episode in magazines and newspapers were the reason or maybe viewers were just celebrating or watching something else? For myself, the Emmerdale Christmas Day episode was indeed terribly disappointing. Oh well, the official 7-day viewer ratings figure says everything, I guess, and wasn't a real hit with TV viewers. These official 7-day results show that the Emmerdale Christmas Day episode was the worst episode for Emmerdale viewer ratings since 3 July 2015.

    Similar graphs for viewer ratings for Coronation Street and EastEnders show no real growth over the last 7 months.


  5. #5
    Join Date
    Sep 2013
    Posts
    1,085
    Thanked: 706
    Here are the graphs for the official BARB 7-day viewing ratings for the three main UK soaps for 1st June 2015 to 26th February 2016 (271 days).


    Emmerdale shows an average trend of increased viewing ratings of 0.59 million (+12%) from 1 June 2015 to 26 Feb 2016. At this rate, the yearly increase to end of 30 May 2016 (365 days) would be expected to be 0.79 million (+16%).

    EastEnders shows an average trend of increased viewing ratings of 1.05 million (+16%) from 1 June 2015 to 26 Feb 2016. At this rate, the yearly increase to end of 30 May 2016 (365 days) would be expected to be 1.41 million (+22%).

    Coronation Street shows an average trend of increased viewing ratings of 0.05 million (some 50,000, so +0.8%) from 1 June 2015 to 26 Feb 2016. At this rate, the yearly increase to end of 30 May 2016 (365 days) would be expected to be about 0.07 million (around or less than 70,000, so 1.1%).

Thread Information

Users Browsing this Thread

There are currently 1 users browsing this thread. (0 members and 1 guests)

Posting Permissions

  • You may not post new threads
  • You may not post replies
  • You may not post attachments
  • You may not edit your posts
  •